Individual commitment to a group effort — that is what makes a team work, a company work, a society work, a civilization work.
Vince Lombardi
This section of the report appears after the meeting ends, and shows when and how people interacted with the online meeting.
As a general rule, people actively contributing to the online meeting are more likely to be engaged in the work of the meeting and less likely to be multi-tasking by checking their email or surfing the web. If you're having difficulty getting good engagement from a group, try giving them more to do in your meeting and see if this increased participation changes that dynamic.
Participation Report Content
Participation chart
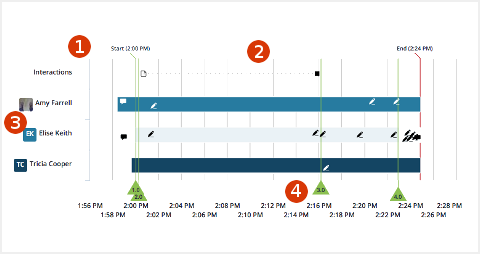
Screenshot of the participation chart for a small team meeting
This chart shows:
- The meeting start and end time
- The duration of any presentations and when people added content
- Who attended, when they arrived and left
- When each agenda item started
Participation table
Here you'll see counts for each agenda item and for the meeting as a whole of notes, group chat messages, who raised their hands, and presentation minutes.
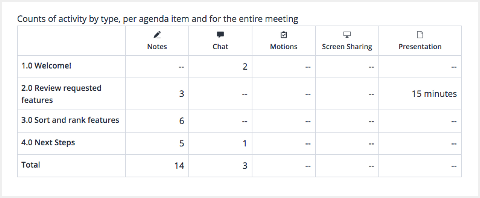
Screenshot of the participation table for the same small team meeting
People who did not attend
Anyone invited to the meeting who did not attend will appear here.
